Data Analysis Portfolio
Design @HueVuong
From Data to Decisions — Visualizing the Why Behind the What
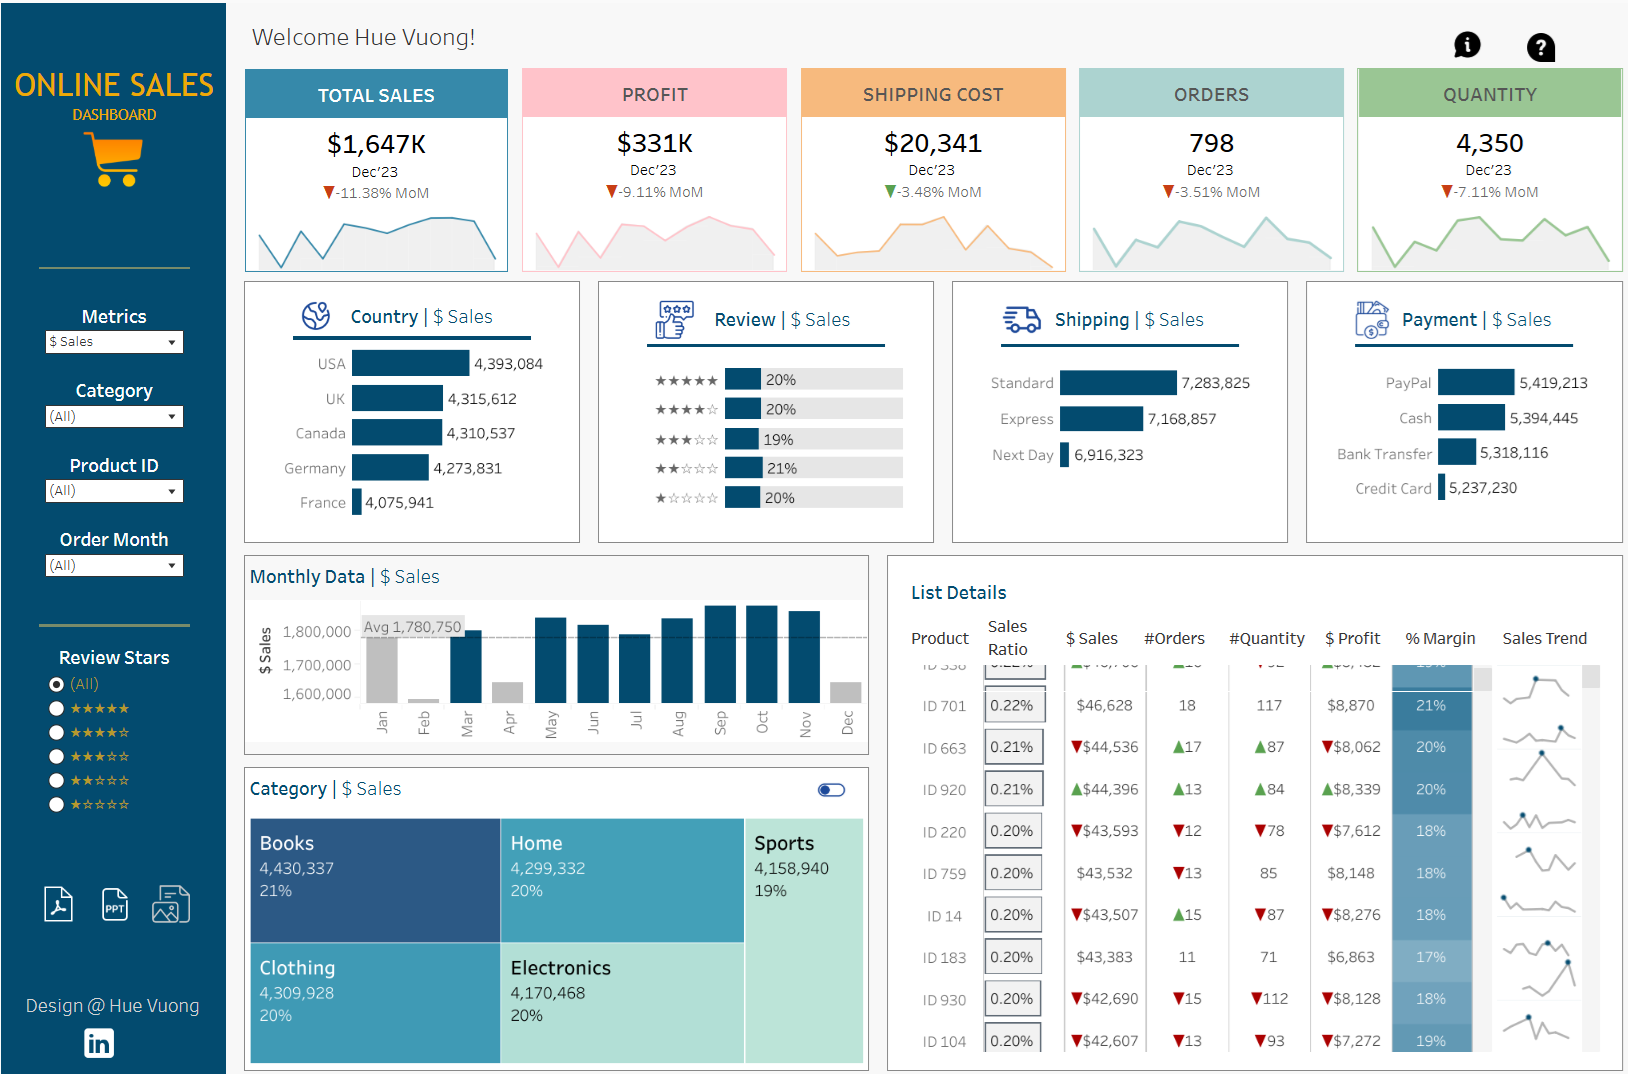
Online Sales Dashboard
Interactive Tableau dashboard visualizing sales performance to help optimize business decisions. Link.

Crypto User Churn Analysis
The project analyzed user engagement and trading behavior to identify retention drivers on a crypto exchange. Python Link
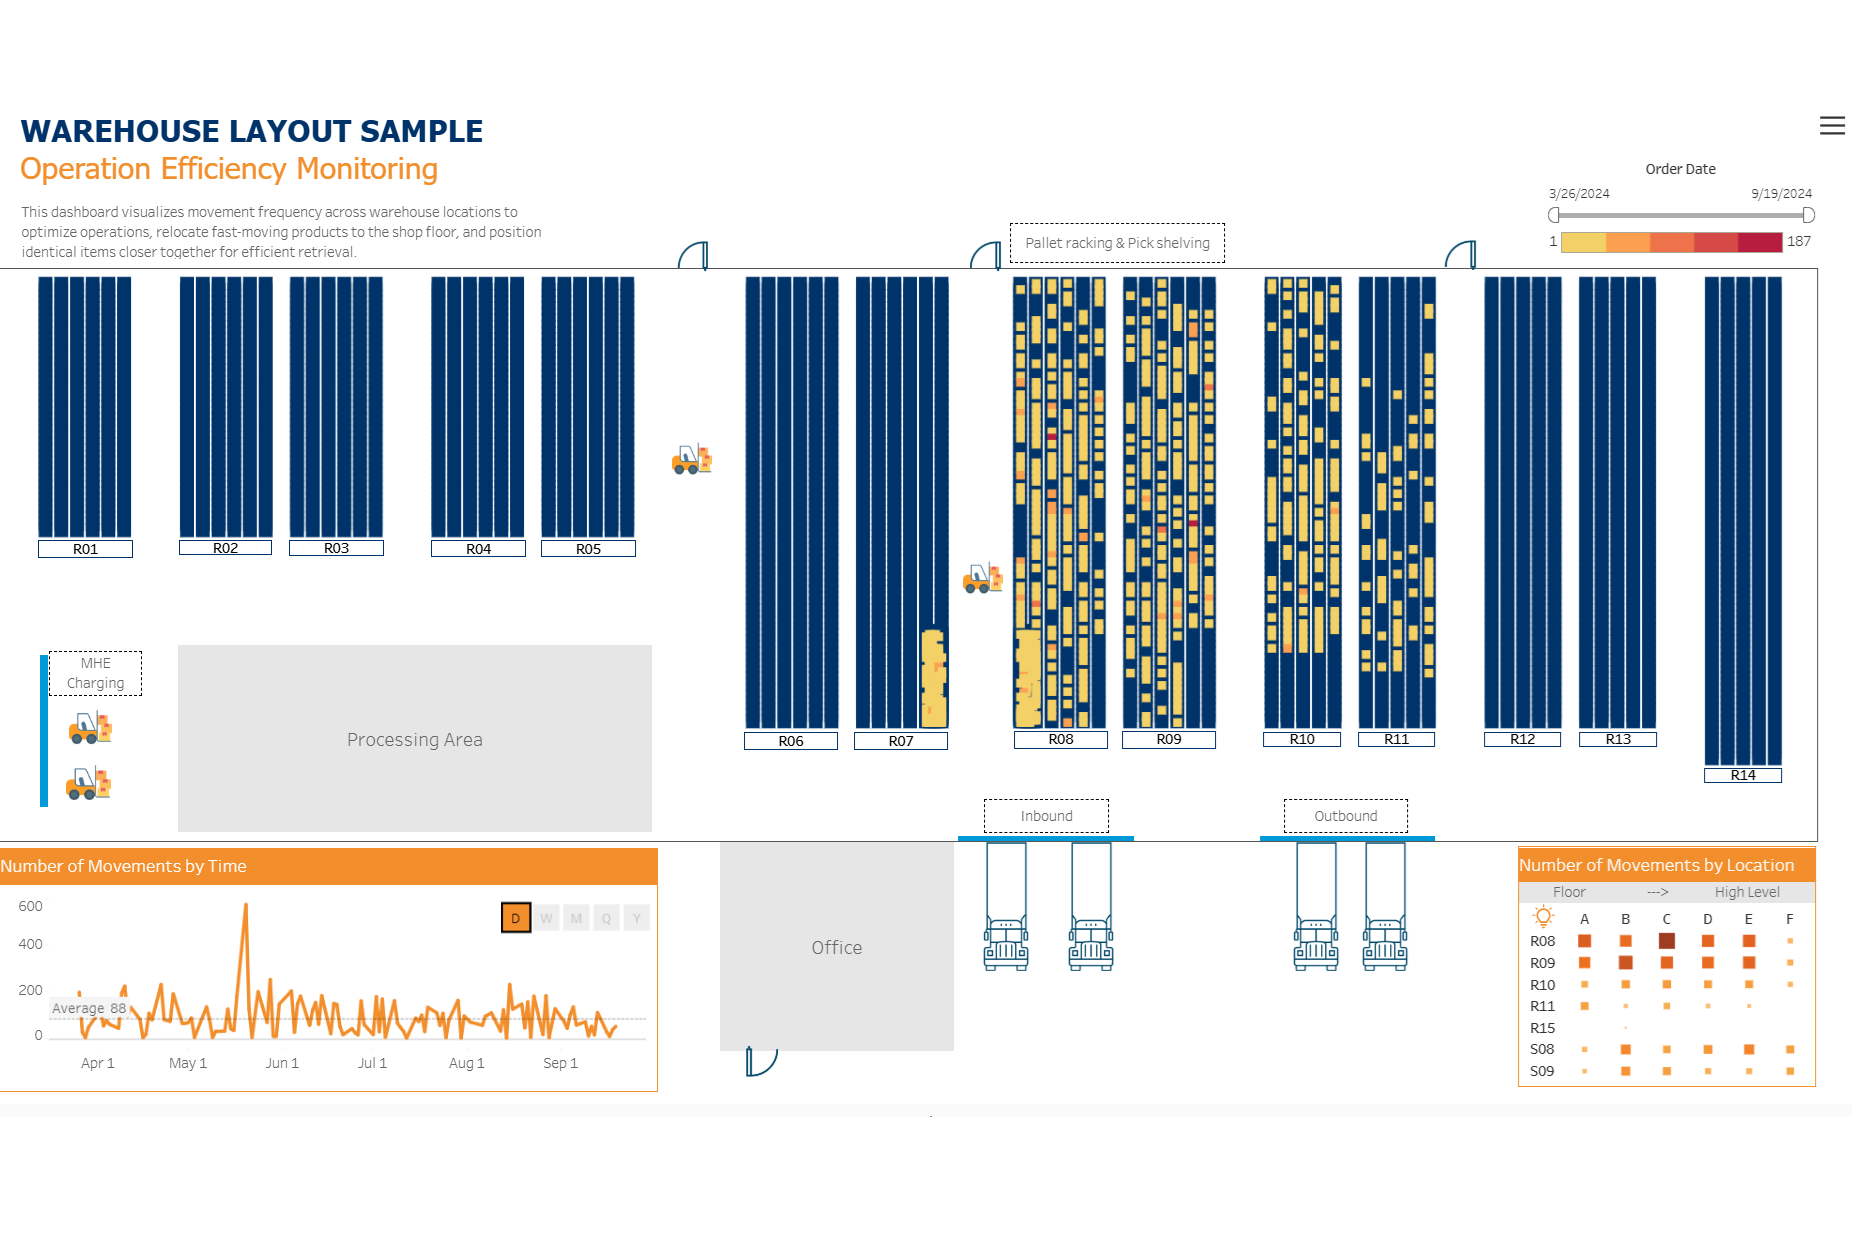
Where is my stock?
Warehouse Operation project focused on inventory management and warehouse optimization solutions.
Clean House - Clean Data
Data cleansing toolkit using SQL Server applied to a house mortgage dataset for improved data quality. Details
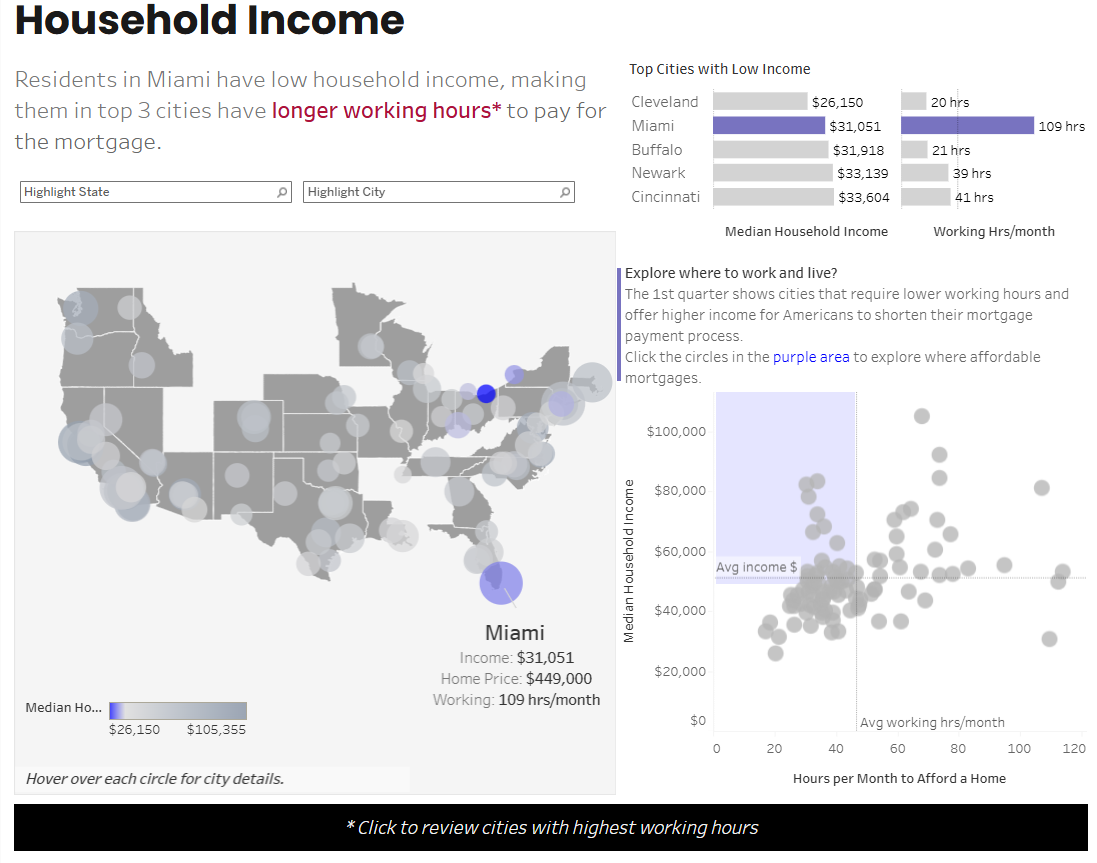
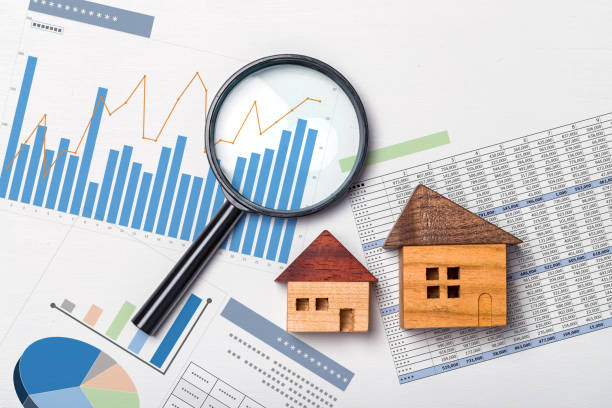
US House Mortgage
Tableauvisualization of mortgage insights across the US based on income and working hours, helping users identify financially suitable areas. Details

Price Optimization Strategy
This project aims to optimize product prices to maximize revenue using data-driven insights with PostgreSQL

Sales Pulse Bot
This project automates monthly sales performance reporting by fetching data with SQL, processing it in Python, and delivering formatted updates to the team’s Slack workspace via a Slack bot using the Slack API. Link

Healthcare Analysis
SQL-driven data cleansing and exploratory analysis of COVID-19 patient data and demographics.

Restaurant Analysis
SQL-based data manipulation for exploratory analysis of restaurant sales, peak hours, and menu performance to boost sales and improve service.
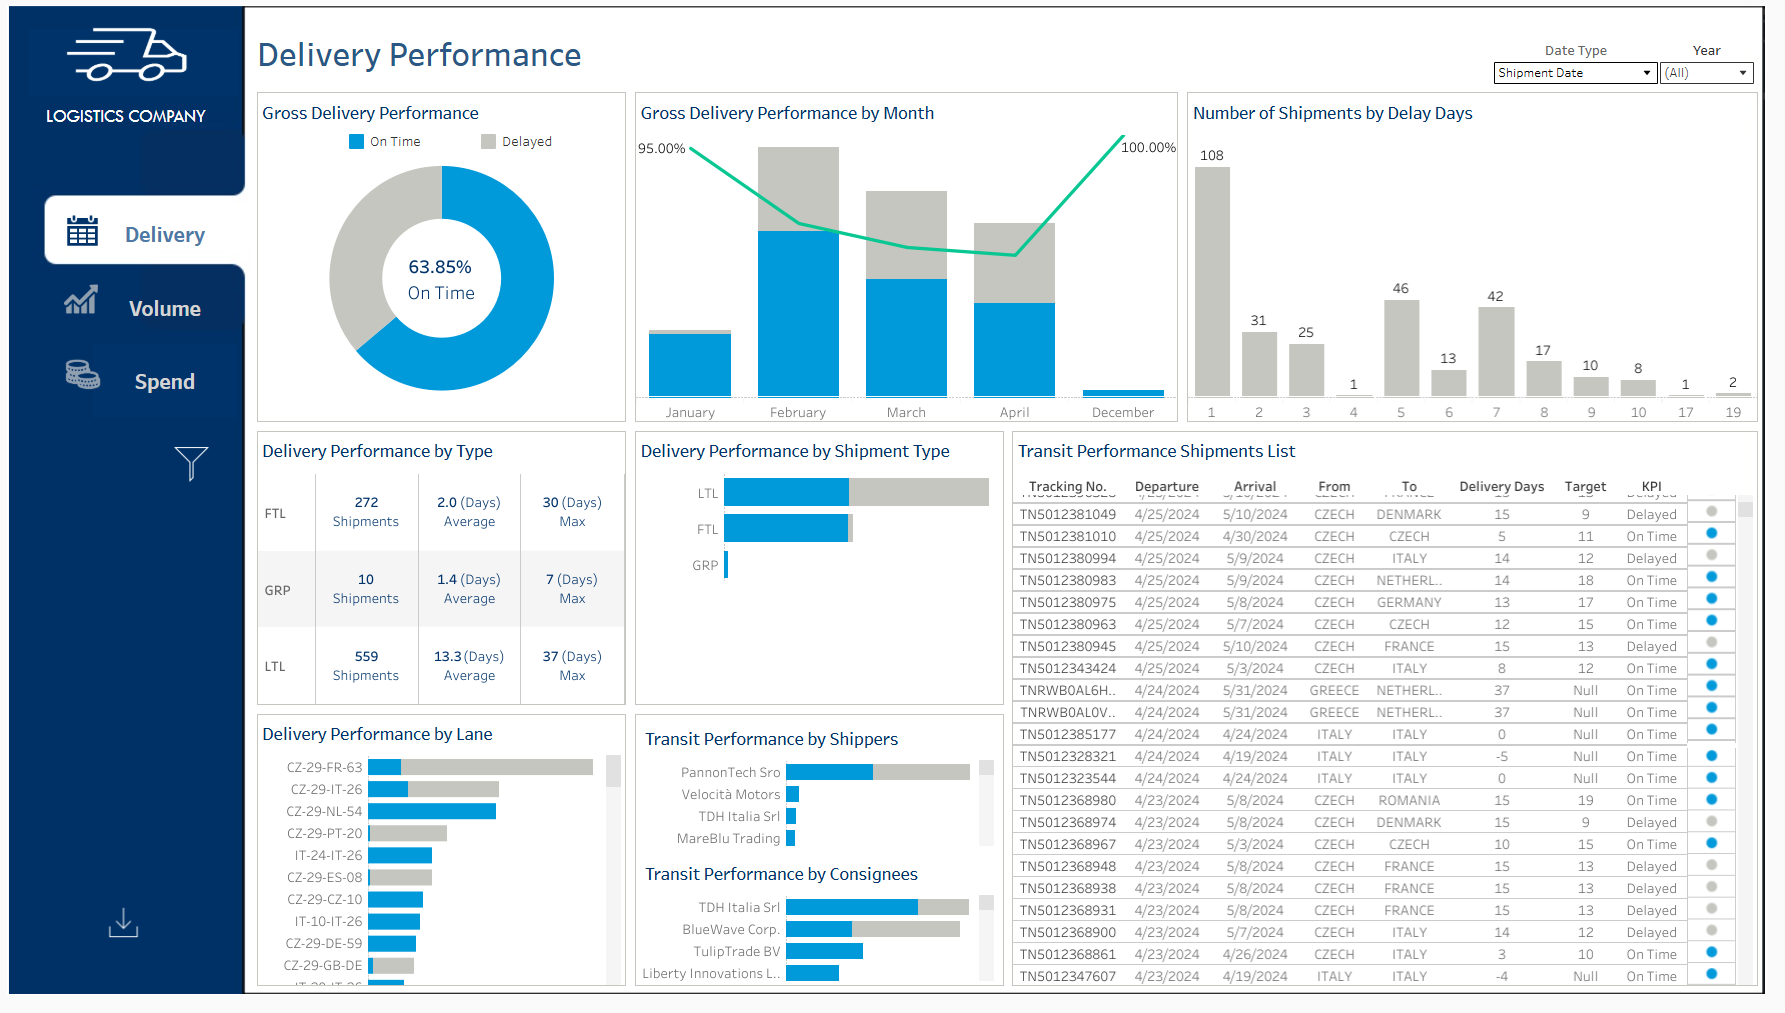
Logistics Performance
Dashboard presenting multiple views of logistics KPIs such as delivery time, volume, and spend to help optimize transportation costs through consolidation by location, shipper, or mode.

Web Scrapping
Python scripts to extract live data from websites, enriching datasets for further analysis.
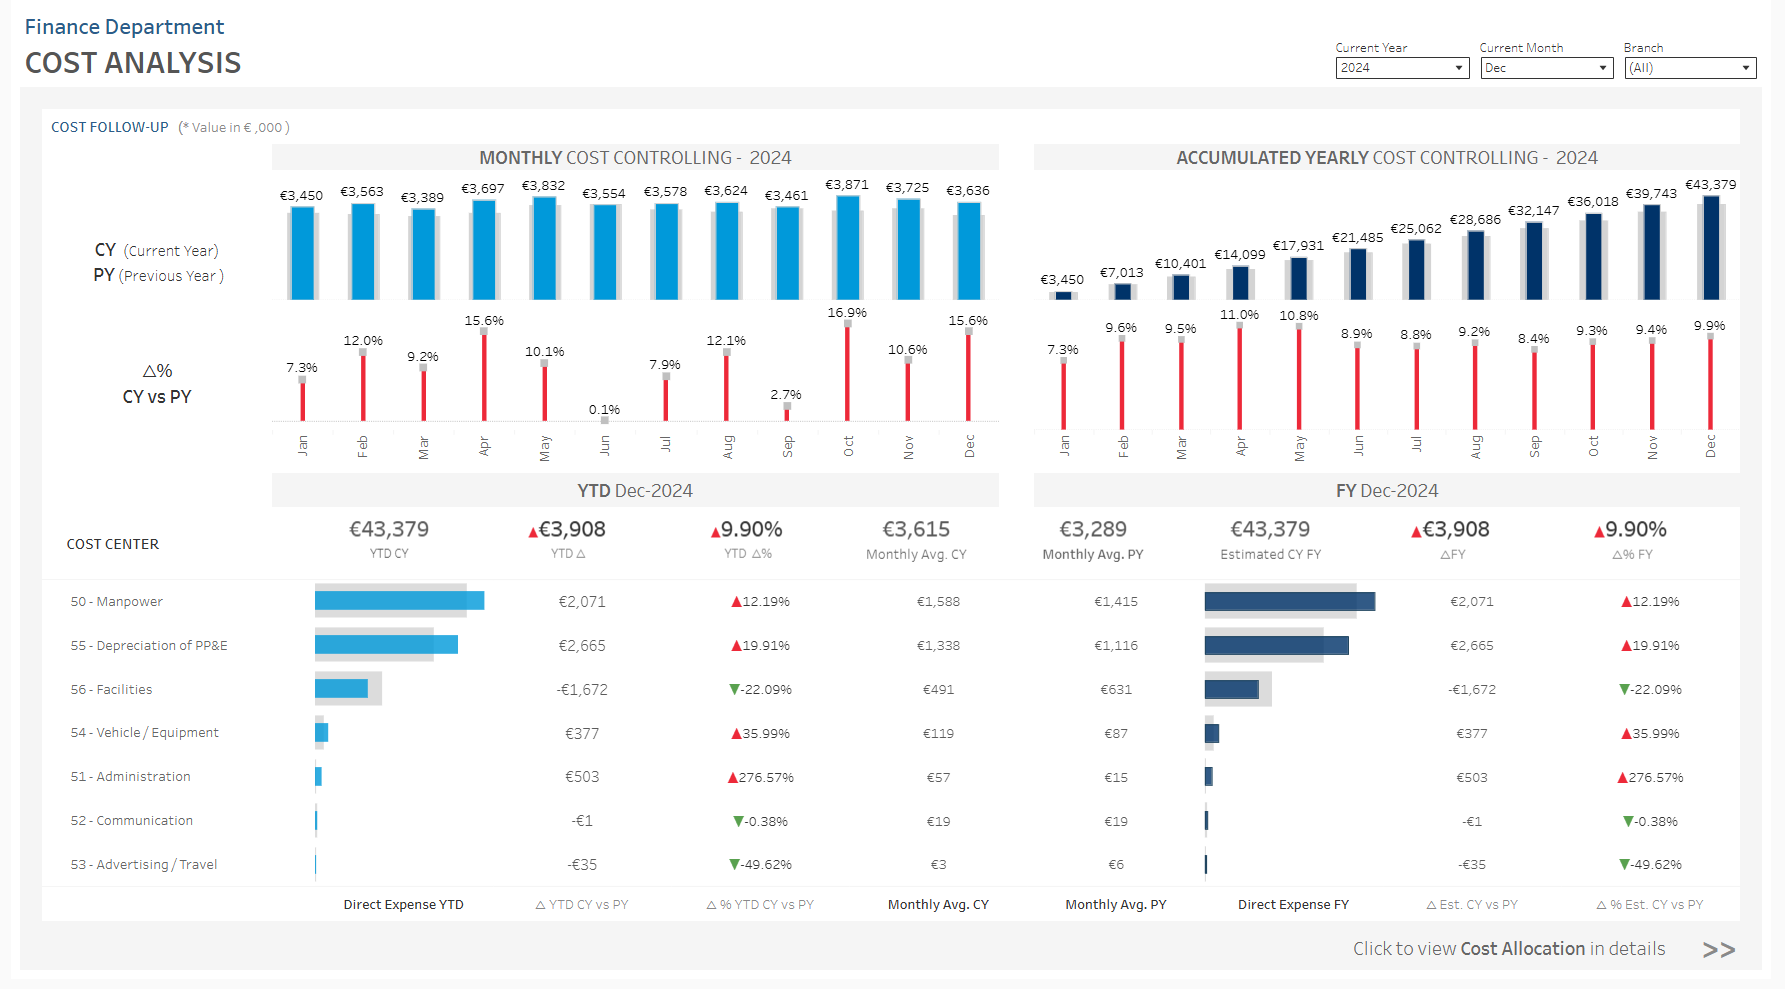
Financial Performance
Project analyzing financial metrics with cost analysis to optimize spending, forecast budgets, and automate profit & loss reporting. Details
- © Untitled. All rights reserved.
- Design: Hue Vuong